|
|
Fixed Income / Credit Analysis
Our investment methodology seeks to overlay a disciplined ranking strategy of fixed income securities to identify the issuers that have superior liquidity profile, improving credit performance, and a strong capitalization that can withstand external shocks better than their peers.
The process doesn’t rely on credit ratings provided by credit rating agencies (such as Moody’s and S&P), but can be used within any rating category to identify better capitalized and improving credits thus helping avoid issuers with deteriorating fundamentals. It is our core belief that when managing fixed income assets, outperformance is generated primarily by avoiding deteriorating credits – rather than trying to guess future changes in the yield curve or market timing fixed income exposure.
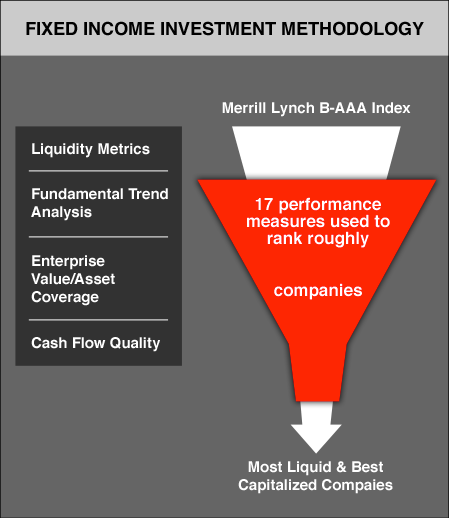
Through our fixed income securities ranking process we measure 17 performance/credit metrics for each issuer based on publicly filed financial statements, updated quarterly. These 17 metrics are grouped into four broad measurement categories (in order of importance to the methodology):
- Liquidity Metrics Analysis – measures ability to withstand external shocks
- Fundamental Trend Analysis – directional analysis through the business cycle
- Enterprise Value/Asset Coverage – measures debt coverage as a function of balance sheet and capitalization
- Cash Flow & Credit Quality – an analysis of EBITDA-driven free cash flow computation versus Statement of Cash Flows-driven free cash flow computation as well our proprietary risk analysis, partially driven by the Altman-Z Score (a default risk tool).
The banking sector and bank stock are treated differently in our methodology, due to their unique business models that over-emphasize accrual accounting. As a result, the metrics we track are somewhat different than our corporate metrics, but generally fall in the same categories. Furthermore, our bank credit and equity rankings are unique to the banking sector, and therefore for example, a 70% credit score for a bank implies only that it ranks higher than 70% of the bank universe, not our entire coverage universe.
Our credit rankings (100% representing the best capitalized companies, 10% the worst) can be used for portfolio construction to limit reliance on credit rating agency ratings, or within rating agency ratings categories to favor better capitalized companies. Furthermore, our rankings show four sub-categories within credit rankings, thus users can decide to favor certain elements of credit strength, or at least gain insight on what drives a specific company's overall credit rank.
Do our credit rankings work? Grouping companies in our corporate coverage universe in ranking categories of 10 percentiles of ranking increment, has consistently shown an R Squared to actual Spread to Treasury of 90% to 98%.
.png)